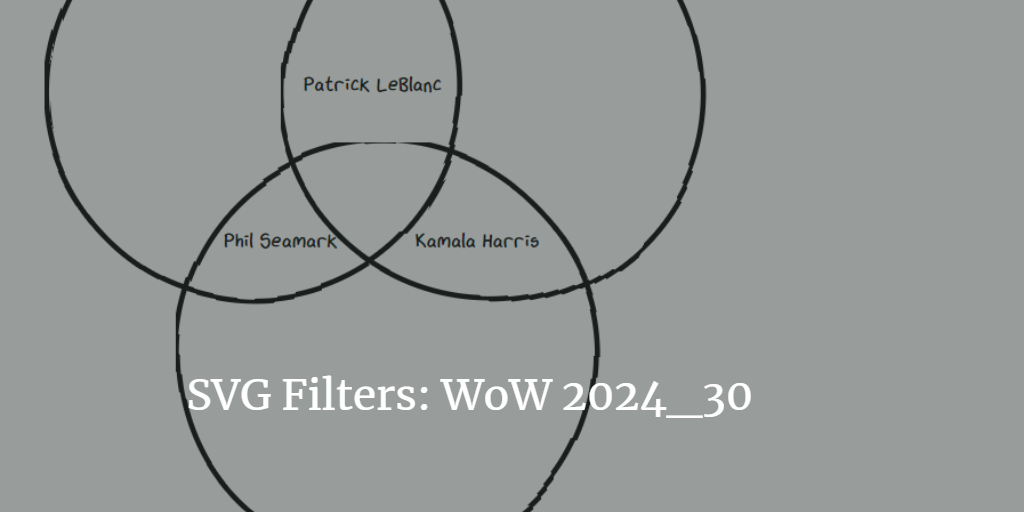
SVG Filters and more SVG crazy stuff at Workout Wednesday 2024_30
A new week comes with a new excercise of Workout Wednesday by Kerry Kolosko: Now SVG Filters. Here are my learnings from this excercise. Grab my solution PBIX here, in case you are interested.

This exercise was somewhat exotic to me…not only that I have just learnt about Deneb now we are doing visuals as SVG…so it shortly ocurred to me : “Why on earth are the Power BI core visuals not enough?”
I am really skeptical if I would go down this path in business doing SVG visuals and maintaining them. However it doesn’t hurt to learn new things as you will never know when you might need it, right? 😀
Data Modeling was not too special with the two column csv for the trend searches provided so let’s jump right to the Venn-Diagramming.
Meet Bing Copilot
I couldn’t have succeeded in this excercise without using Bing Copilot for the SVG stuff.
It got me started rather quickly providing a basic SVG markup for a venn diagram:
<svg width="200" height="200" xmlns="http://www.w3.org/2000/svg">
  <!-- First Circle: Good at Power BI -->
  <circle cx="50" cy="50" r="40" style="fill: red; fill-opacity:0.5;"/>
  <text x="50" y="45" font-size="8" text-anchor="middle" fill="black">Good at Power BI</text>

  <!-- Second Circle: Eligible for President -->
  <circle cx="100" cy="50" r="40" style="fill: green; fill-opacity:0.5;"/>
  <text x="100" y="45" font-size="8" text-anchor="middle" fill="black">Eligible for President</text>

  <!-- Third Circle: Unusual love for venn diagrams -->
  <circle cx="75" cy="90" r="40" style="fill: blue; fill-opacity:0.5;"/>
  <text x="75" y="85" font-size="8" text-anchor="middle" fill="black">Unusual love for venn diagrams</text>
</svg>

However this was a mere starting point…a few Copilot conversations and 11 one drive iterations later I had the overlapping Venn-Diagram-Look I needed.
<svg width="200" height="200" xmlns="http://www.w3.org/2000/svg" style="background: white;">
  <!-- First Circle: Good at Power BI -->
  <circle cx="50" cy="50" r="40" style="fill:none; stroke: black; stroke-width: 2;"/>
  <text x="50" y="45" font-size="8" text-anchor="middle" fill="black">Good at Power BI</text>

  <!-- Second Circle: Eligible for President -->
  <circle cx="100" cy="50" r="40" style="fill: none; stroke: black; stroke-width: 2;"/>
  <text x="150" y="45" font-size="8" text-anchor="middle" fill="black">Eligible for President</text>

  <!-- Third Circle: Unusual love for venn diagrams -->
  <circle cx="75" cy="100" r="40" style="fill: none; stroke: black; stroke-width: 2;"/>
  <text x="100" y="95" font-size="8" text-anchor="middle" fill="black">Unusual love for venn diagrams</text>
</svg>

At revision 25 I had the texts in the right place (did some manual fiddling with x and y)
Revision 45 featured all texts out and inside the Venn at the right place but still didn’t feature the XKCD look.
<svg width="400" height="400" xmlns="http://www.w3.org/2000/svg" style="background: white;">
  <!-- First Circle: Good at Power BI -->
  <circle cx="90" cy="100" r="80" style="fill:none; stroke: black; stroke-width: 2;"/>
  <text x="40" y="8" font-size="8" text-anchor="middle" fill="black">Good at Power BI</text>

  <!-- Second Circle: Eligible for President -->
  <circle cx="180" cy="100" r="80" style="fill: none; stroke: black; stroke-width: 2;"/>
  <text x="200" y="8" font-size="8" text-anchor="middle" fill="black">Eligible for President</text>

  <!-- Third Circle: Unusual love for venn diagrams -->
  <circle cx="140" cy="200" r="80" style="fill: none; stroke: black; stroke-width: 2;"/>
  <text x="140" y="290" font-size="8" text-anchor="middle" fill="black">Unusual love of </text>
  <text x="140" y="300" font-size="8" text-anchor="middle" fill="black">Venn diagrams </text>


  <!-- Labels for Intersections -->
  <text x="135" y="100" font-size="8" text-anchor="middle" fill="black">Patrick LeBlanc</text>
  <text x="100" y="160" font-size="8" text-anchor="middle" fill="black">Phil Seamark</text>
  <text x="170" y="160" font-size="8" text-anchor="middle" fill="black">Kamala Harris</text>
</svg>

Revision 50 then featured the squiggly circles as xkcdFilter. I asked Copilot for that as I didn’t understand the resource shared with the excercise to follow along.
<svg width="400" height="400" xmlns="http://www.w3.org/2000/svg" style="background: white;">
   <!-- Define the filter -->
  <defs>
    <filter id="xkcdFilter" x="0" y="0">
      <feTurbulence type="fractalNoise" baseFrequency="0.01" numOctaves="3" result="noise"/>
      <feDisplacementMap in="SourceGraphic" in2="noise" scale="8" />
    </filter>
  </defs>

  <!-- First Circle: Good at Power BI -->
  <circle cx="90" cy="100" r="80" style="fill:none; stroke: black; stroke-width: 2;" filter="url(#xkcdFilter)"/>
  <text x="40" y="8" font-size="8" text-anchor="middle" fill="black">Good at Power BI</text>

  <!-- Second Circle: Eligible for President -->
  <circle cx="180" cy="100" r="80" style="fill: none; stroke: black; stroke-width: 2;" filter="url(#xkcdFilter)"/>
  <text x="200" y="8" font-size="8" text-anchor="middle" fill="black">Eligible for President</text>

  <!-- Third Circle: Unusual love for venn diagrams -->
  <circle cx="140" cy="200" r="80" style="fill: none; stroke: black; stroke-width: 2;"filter="url(#xkcdFilter)"/>
  <text x="140" y="290" font-size="8" text-anchor="middle" fill="black">Unusual love of </text>
  <text x="140" y="300" font-size="8" text-anchor="middle" fill="black">Venn diagrams </text>


  <!-- Labels for Intersections -->
  <text x="135" y="100" font-size="8" text-anchor="middle" fill="black">Patrick LeBlanc</text>
  <text x="100" y="160" font-size="8" text-anchor="middle" fill="black">Phil Seamark</text>
  <text x="175" y="160" font-size="8" text-anchor="middle" fill="black">Kamala Harris</text>
</svg>

The final version (revision 60) then incorporates the XKCD font copied from aaizemberg (everything before the SVG):
<head>
  <meta charset="utf-8">
  <meta name="viewport" content="width=device-width">
  <title>xkcd font</title>
  <script src="https://cdnjs.cloudflare.com/ajax/libs/webfont/1.6.28/webfontloader.js"></script>
  <style>
    @font-face {
	    font-family: xkcd;
	    src: url('https://cdn.rawgit.com/ipython/xkcd-font/master/xkcd-script/font/xkcd-script.woff') format('woff');
    }
    .xkcd {
  	  font-family: xkcd;
    }
  </style>
</head>
<body>


<script>
  WebFont.load({
    custom: {
      families: ['xkcd']
    },
    active: function() {
    	draw();
    }
  });

  function draw() {
    var canvas = document.getElementById("myCanvas");
    var ctx = canvas.getContext("2d");
    ctx.font = "2em xkcd";
    ctx.fillText("Using the xkcd font (html5 canvas)",0,30);
  }
  </script>


<svg width="400" height="400" xmlns="http://www.w3.org/2000/svg" style="background: white;">
   <!-- Define the filter -->
  <defs>
    <filter id="xkcdFilter" x="0" y="0">
      <feTurbulence type="fractalNoise" baseFrequency="0.01" numOctaves="3" result="noise"/>
      <feDisplacementMap in="SourceGraphic" in2="noise" scale="8" />
    </filter>
  </defs>

  <!-- First Circle: Good at Power BI -->
  <circle cx="90" cy="100" r="80" style="fill:none; stroke: black; stroke-width: 2;" filter="url(#xkcdFilter)"/>
  <text x="60" y="10" font-family="xkcd" font-size="12" text-anchor="middle" fill="black">Good at Power BI</text>

  <!-- Second Circle: Eligible for President -->
  <circle cx="180" cy="100" r="80" style="fill: none; stroke: black; stroke-width: 2;" filter="url(#xkcdFilter)"/>
  <text x="200" y="8" font-family="xkcd" font-size="12" text-anchor="middle" fill="black">Eligible for President</text>

  <!-- Third Circle: Unusual love for venn diagrams -->
  <circle cx="140" cy="200" r="80" style="fill: none; stroke: black; stroke-width: 2;"filter="url(#xkcdFilter)"/>
  <text x="140" y="300" font-family="xkcd" font-size="12" text-anchor="middle" fill="black">Unusual love of </text>
  <text x="140" y="310" font-family="xkcd" font-size="12" text-anchor="middle" fill="black">Venn diagrams </text>


  <!-- Labels for Intersections -->
  <text x="135" y="100" font-family="xkcd" font-size="8" text-anchor="middle" fill="black">Patrick LeBlanc</text>
  <text x="100" y="160" font-family="xkcd" font-size="8"  text-anchor="middle" fill="black">Phil Seamark</text>
  <text x="175" y="160" font-family="xkcd" font-size="8"  text-anchor="middle" fill="black">Kamala Harris</text>
</svg>

SVG Line charts
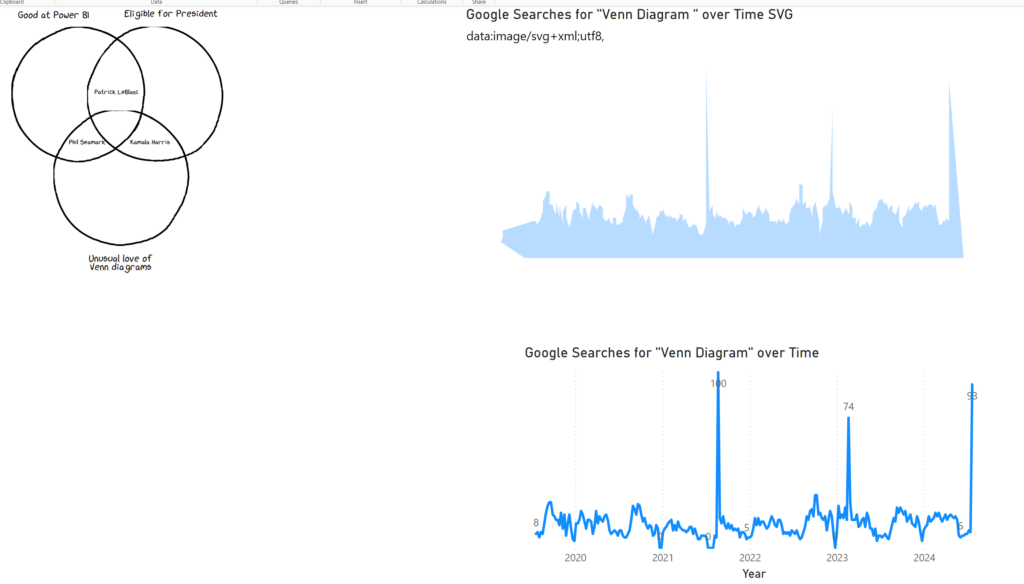
I also tried to adjust Kerry Kolosko’s example of a area sparkline for the SVG Line chart. This kind of worked in a sense that I got an output…but then again I had three peaks instead of one…maybe something I missed with data preprocessing….so no credits for me there.
Final thoughts
To me it was impressive how much Bing Copilot could assist me in this SVG coding example. Well sure I have done some web development back at University but these days are way back and I am by no way any expert in coding SVG. As a user with such limited knowledge about a topic you can quickly set up something new with the assistance of Generative AI.
Regarding SVGs…I know that’s an option but I would refrain from using it in Power BI as it quickly leads to spending a lot of time on a single visual where IMHO there is more to be won in curating data and making them accessible through core visuals. I do fancy Deneb to some point so will concentrate on learning and mastering this first if I need visual customization rather than going for SVG.